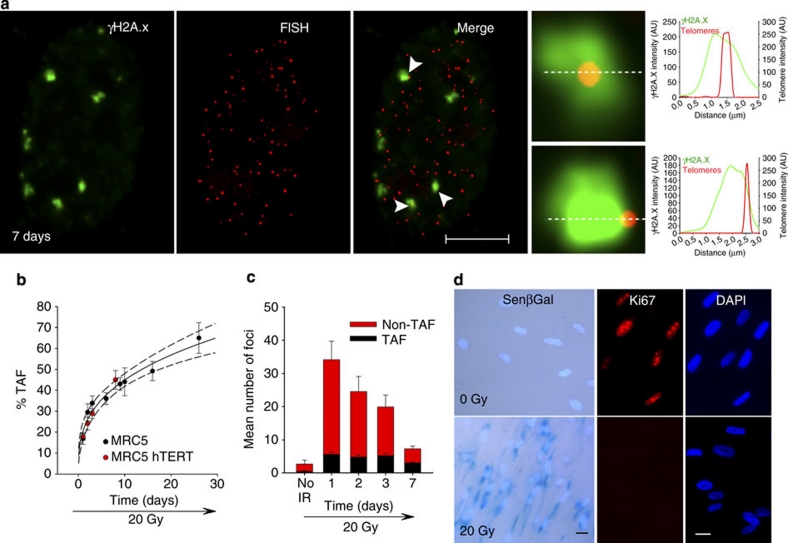
Figure 3. Overexpression of hTERT in MRC5 fibroblasts does not suppress irradiation-induced cellular senescence and persistence of TAF.
(a) Representative image of γH2A.X immuno-FISH in MRC5 fibroblasts overexpressing hTERT 7 days after 20 Gy. Images are Huygens (SVI) deconvolved Z projections of 3-μm stacks taken with a ×100 oil objective. White arrows indicate colocalization, and colocalizing foci are amplified in the right panel (amplified images are from single Z planes where colocalization was found). Graphs represent quantification of γH2A.X and telomere signals in selected regions of interest (dotted lines). Scale bar: 10 μm. (b) Comparison between % TAF in MRC5 fibroblasts with or without telomerase overexpression. Power curve (solid line) and 95% confidence intervals (dotted lines) are shown. Power curve best-fitted time-dependent increase in % TAF (R=0.9770, P=0.0001); Data are mean±s.e.m.; n=15. (c) Mean number of both TAF and non-TAF in MRC5 fibroblasts overexpressing hTERT up to 8 days after irradiation with 20 Gy; Mean±s.e.m.; n=15. (d) 20-Gy irradiation induces cellular senescence in MRC5 fibroblasts overexpressing hTERT. Representative images of staining for Sen-β-Gal (light blue: DAPI staining; cytoplasmic darker blue: Sen-β-Gal activity) and proliferation marker Ki67 (blue: DAPI, red: Ki67). Scale bar: 20 μm.

