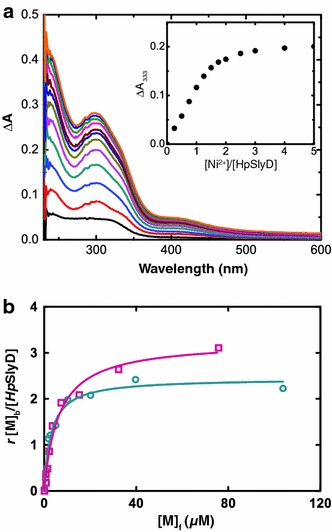
Fig. 4.

a UV difference spectra of 30 μM HpSlyD with addition of 0.25–5 molar equiv of Ni2+. The titration curve plotted with ΔA 333 is shown in the inset. b Metal binding affinity of HpSlyD determined by equilibrium dialysis: Ni2+ (circles) and Zn2+ (squares)
