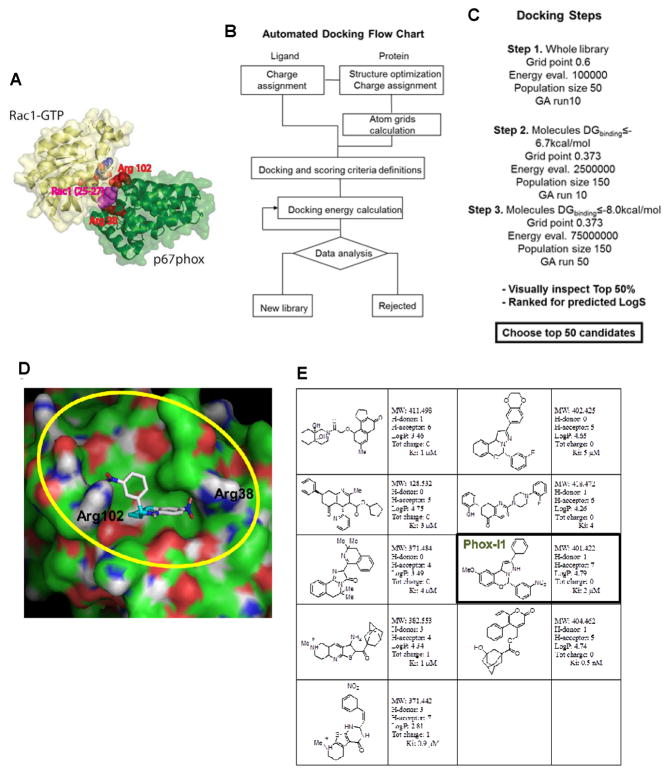
Figure 1. Virtual screening of p67phox inhibitors from the ZINC and UC DDC small molecule libraries.
(A) The structure of the Rac1-p67phox complex is shown. Rac1 is shown in yellow, whereas p67phox is shown in green, respectively. Arginine residues 38 and 102 of p67phox, which surround the site within the interaction interface that was targeted by virtual screening, are shown using red spheres. Rac1 residues 25–27 (Thr-Ans-Ala motif in Switch I) that are buried upon complex formation and are sandwiched by Arg38 and Arg102 are shown in magenta. Arg38 is directly involved in interface formation. (B) The flow chart reports the strategy that was implemented for automated docking. Autodock 4 and related scripts were utilized to assign charges and perform docking energy calculations. (C) The main docking parameters adopted in the three different phases of the screening are displayed. The molecular geometry, cluster convergence, hydrogen bonding and lowest predicted docking energy criteria have been used to select the best 50% of candidates coming out from the third screening step. (D) Molecular surface representation of p67phox in complex with a predicted inhibitor is displayed. The region comprising p67phox Arginine 102 and 38 is defined by our grids and is highlighted in yellow. Docked Energy: −8.77Kcal/mol, Binding energy: −8.90 Kcal/mol, Ki 2.9×10⁻⁷ M−1. (E) A summary of the candidate inhibitors specific for p67phox; their Lipinski parameters and predicted Ki are reported on the side of each molecule.

