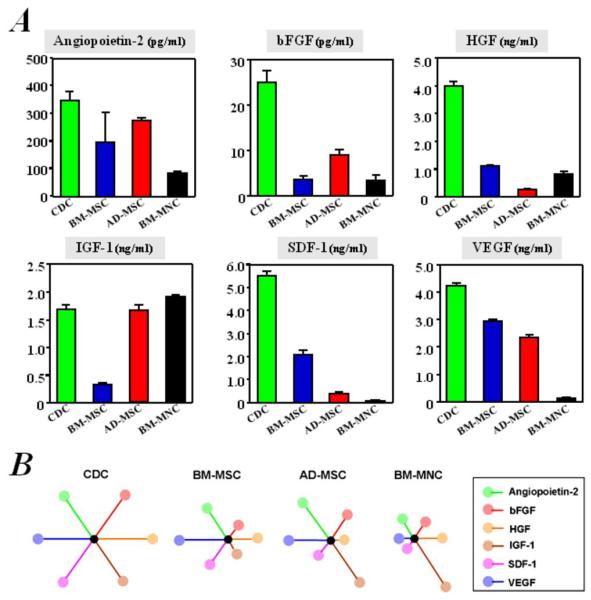
Figure 2. Comparison of in vitro production of growth factors from cells cultured.
Concentrations of angiopoietin-2, bFGF, HGF, IGF-1, SDF-1, and VEGF, measured by ELISA (n=3), are depicted (A). B) Schematic depicting the secretion of each of the six cytokines in each given cell type, as wheel-and-spoke diagrams in which the length of each spoke is proportional to the growth factor concentration in conditioned media and is normalized to that from CDCs. The symmetrical starburst pattern highlights the uniquely well-balanced paracrine profile of CDCs.

