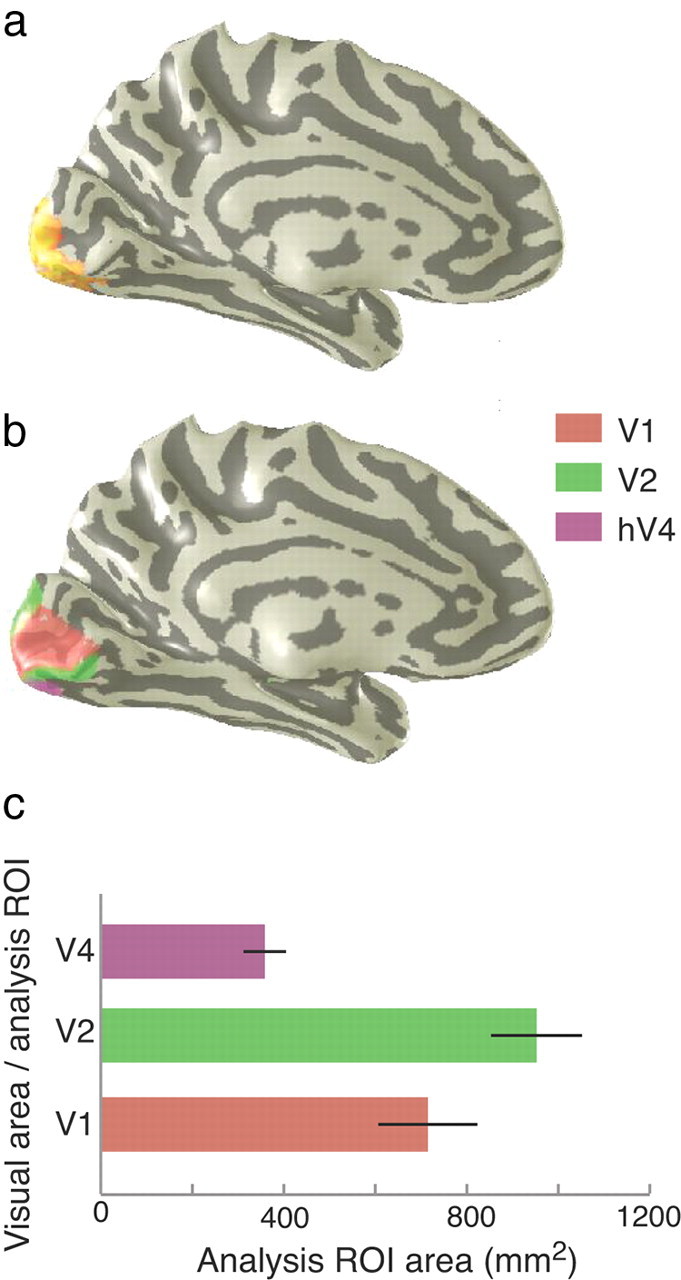
Figure 2.

a, Region activated by the annular stimulus rendered on an inflated cortex. b, V1, V2, and hV4 defined from separate retinotopic mapping experiments shown on a single subject's left hemisphere. c, Average sizes of analysis ROIs. ROIs were defined by intersecting visual area ROIs shown in b with localizers shown in a. Visual area sizes were measured on the 3D mesh. Error bars are 1 SEM.
