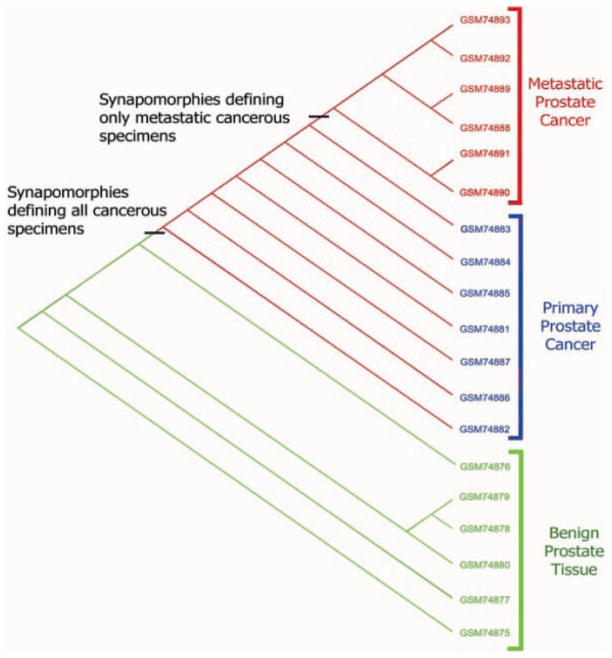
Fig. 1.
The most parsimonious cladogram of the gene expression microarray of dataset GDS1439 (www.ncbi.nlm.nih.gov/sites/entrez?db=gds). The study group contains specimens composed of 6 benign specimens, as well as 7 primary and 6 metastatic prostate carcinoma specimens [33]. The primary and metastatic specimens grouped separately from each other into two groups (clades); while the metastatic occupied the top of the cladogram, the primary was nestled in between the metastatic and benign clades.

