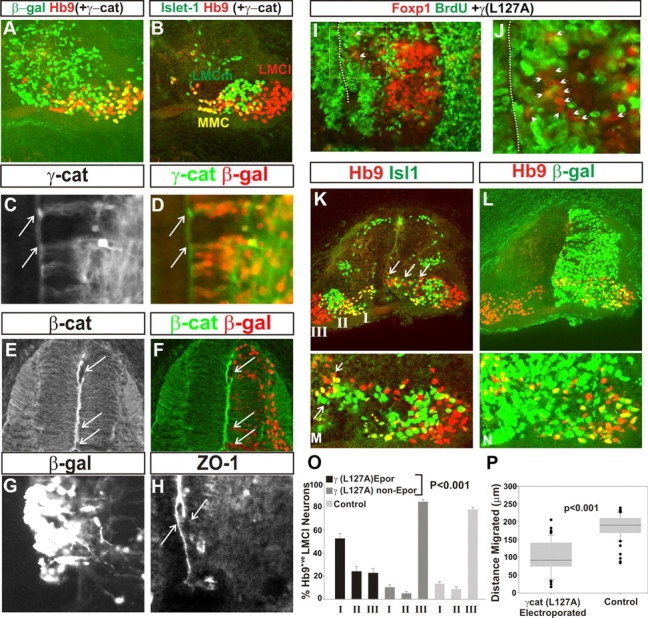
Figure 4.

γ-Catenin (L127A) expression disrupts LMC migration and divisional segregation. A, B, Lack of effect of γ-catenin overexpression on divisional segregation at stage 29. Cells that had been electroporated are marked by β-gal immunoreactivity (A, green). Hb9 (A, B) and Islet-1 (B) mark the medial motor column (MMC), LMCl, and LMCm in the ventral horn. C, D, Expression of γ-catenin (L127A) viewed by γ-catenin immunoreactivity. Electroporated cells are marked by β-gal immunofluorescence (D, red). Arrows, Apical expression of γ-catenin at the ventricle surface. E, F, Disruption of β-catenin apical expression following γ-catenin(L127A) expression. Arrows, Regions of disruption. G, H, Disruption of ZO1 apical expression following γ-catenin(L127A) expression. H, Left arrow, ZO1 apical expression on the contralateral spinal cord; right arrow, disruption on the electroporated side of the spinal cord. I, J, The ventral spinal cord after electroporation with γ-catenin (L127A) at st18. Foxp1 (red) and BrdU (green) expression after BrdU application from st23 to st28. No colocalization of motor nuclei with BrdU was observed, indicating that all motor neurons had been born before st23 following γ-catenin(L127A) expression. J, Magnification of boxed area in I. I, J, Dotted lines, Midline; arrows, Foxp1 nuclei stalled in their migration and are unlabeled by BrdU. K–N, Effects of γ-catenin(L127A) expression on divisional segregation in st29 lumbar spinal cords. K, L, The left side of the spinal cord is unelectroporated (β-gal immunofluorescence is absent; L). K, LMCm and LMCl segregate normally on the left side, as viewed with Hb9 (red) and Islet-1 (green) immunofluorescence. Following γ-catenin(L127A) expression on the right side of the spinal cord, LMCl and LMCm segregation was perturbed. The LMC spread over a much larger area than the control, with LMC cells found close to the ventricle and LMCl and LMCm cells intermingled. K, Arrows, Some of the LMC cells that stalled in their migration. M, N, Ventral horn of a different embryo electroporated by γ-catenin(L127A) showing that both LMCm and LMCl were affected; the midline as at the left side of the panel. M, Arrows, Some of the LMCm and LMCl cells close to the ventricle surface. K, I, II, III, Regions quantitated in O. O, Quantitation of LMCl neuron position in bins illustrated in K. P, Quantitation of distance migrated by γ-catenin(L127A)-expressing LMCl neurons compared with those on the electroporated (Epor) side of the spinal cord that did not express γ-catenin(L127A). Error bars are SEM.
