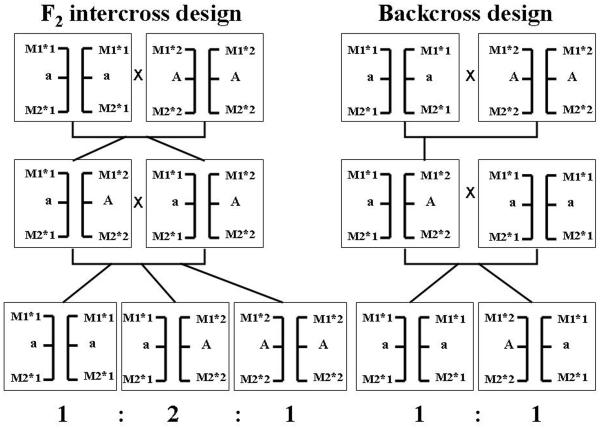
Figure 1.
Schematic illustration of the segregation of a recessive allele a predisposing to disease in an F2 intercross design and a backcross design. The co-segregation with the flanking genetic markers M1, with alleles 1 and 2, and M2, with alleles, 1 and 2, is indicated. The genotype at the disease locus can easily be deduced using these flanking markers.

