
Figure 5.
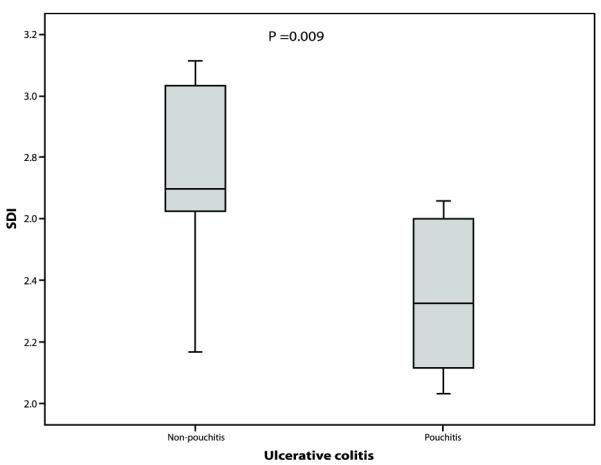
Boxplot comparing the Shannon Diversity index in samples from UC pouchitis patients compared to UC non-pouchitis patient samples.
Official websites use .gov
A
.gov website belongs to an official
government organization in the United States.
Secure .gov websites use HTTPS
A lock (
) or https:// means you've safely
connected to the .gov website. Share sensitive
information only on official, secure websites.
Boxplot comparing the Shannon Diversity index in samples from UC pouchitis patients compared to UC non-pouchitis patient samples.