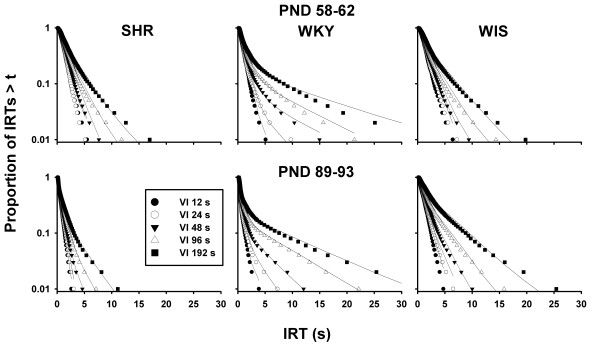
Figure 5.
Semi-log survival plots showing the mean proportion of IRTs greater than t in each schedule (symbols), strain (columns), and epoch (rows). Proportions were calculated for each rat in bins that contain, each, 1% of the IRTs; binned proportions were then averaged over rats. Curves through the data are the mean traces of the bout-and-pause model (Equation 3), drawn using maximally likely individual estimates. SHR survival functions (left panels) were steeper and more linear than those of WKY (center panels), indicating, respectively, shorter IRTs (higher response rate) and responses organized in less distinct bouts.

