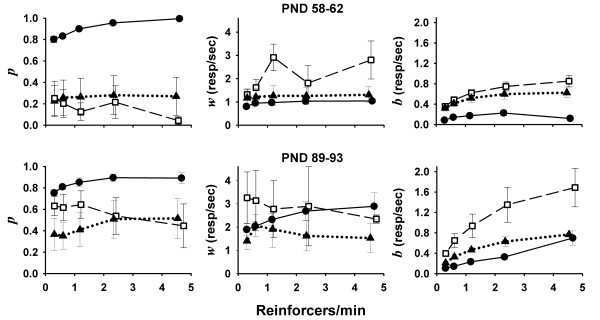
Figure 6.
Mean (± SEM) estimates of bout-and-pause parameters (Equation 3) as a function of mean rate of reinforcement, for each strain (SHR: squares; WKY: circles; WIS: triangles) in epochs 1 and 2 (top and bottom panels, respectively). In all epochs and schedules, SHR emitted shorter but more frequent bouts (low p in left panel, high b in right panel) than WKY. During epoch 1 SHR emitted faster within-bout responses (high w in top-center panel), but estimates of w were only possible for 2-3 out of 6 SHR rats; estimates of w were possible for all 6 WKY.

