
Figure 5.
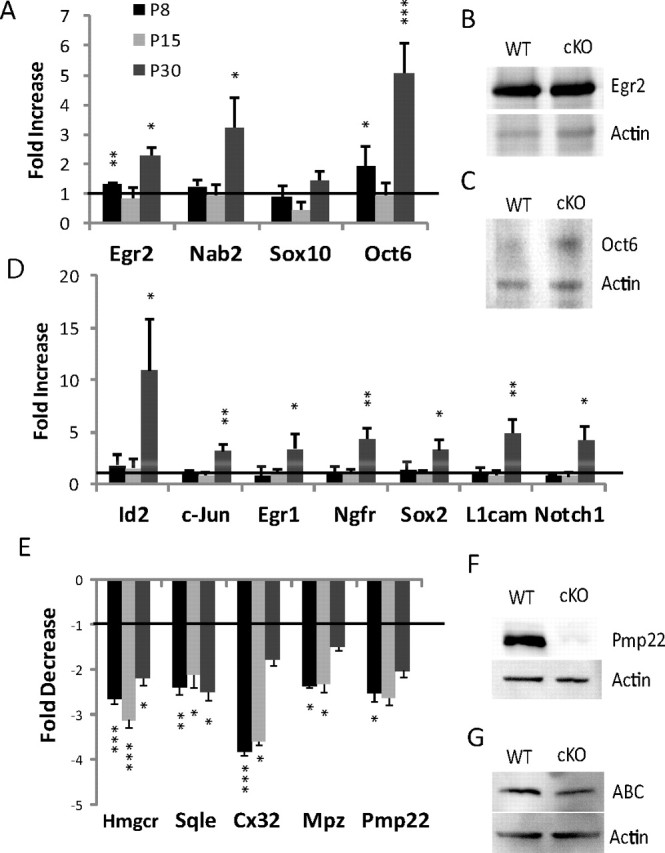
Chd4 deletion results in deregulation of Schwann cell genes induced and repressed during development. A, B, The mRNA expression levels for the indicated genes were determined by quantitative RT-PCR from sciatic nerve samples at the P8, P15, and P30 time points. Expression data are presented as a ratio of Chd4 mutant compared with wild-type mRNA levels (C). P30 protein levels of Egr2 (D), Oct6 (E), activated β-catenin (G), and P4 levels of Pmp22 (F) mirror the levels found in the mRNA expression data. Error bars indicate SD. Line represents relative level in wild-type mice. *p < 0.05; **p < 0.01; ***p < 0.005.