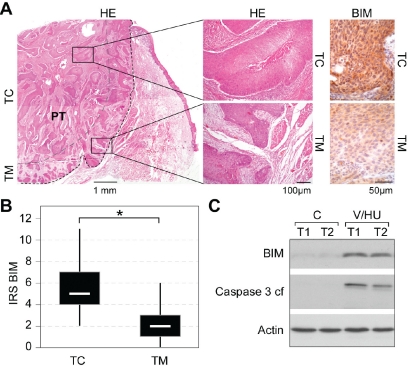
Figure 4. BIM expression in tumor biopsies from head and neck carcinoma patients.
A) Detection of BIM in HNSCC tumor centers (TC) versus proliferating tumor margins (TM). Representative example of an oral SCC (G2, pT3, pN0) stained with hematoxylin/eosin (HE) (left panel) and immunohistochemical visualization of BIM using α-BIM Ab (right panel). B) Box plot (with range) for BIM IRS reveals enhanced BIM expression in the TC in HNSCC patient biopsies (*p<0.001; n=31). C) Treatment of freshly isolated tumor cells from two patients (T1: Hypopharynx, G2, pT3, pN0; T2: oral cavity, G3, pT3, pN0) with VPA/HU (1.5/0.5 mM) for 48 h resulted in BIM induction and Caspase-3 activation. Indicated proteins were detected by immunoblot analysis. Actin served as loading control

