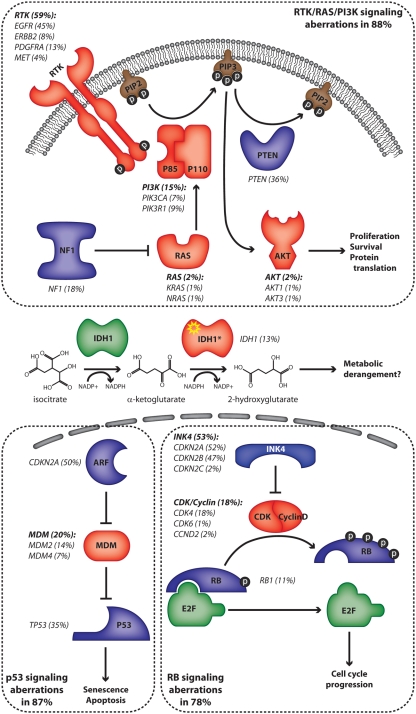
Figure 1. Frequency of pathway mutations in high-grade astrocytoma.
The frequency of mutations affecting intermediates of several pathways is indicated in parentheses. Proteins whose genes are amplified or have an activating mutation are represented in red while those whose genes are deleted or have an inactivating mutation are in blue. The proteins are grouped according to the core pathways in which they function (dotted lines). The IDH1 mutant proteins (IDH1*) possess a neomorphic catalytic activity which is depicted. The frequencies of mutations are derived from references 14 and 22.

