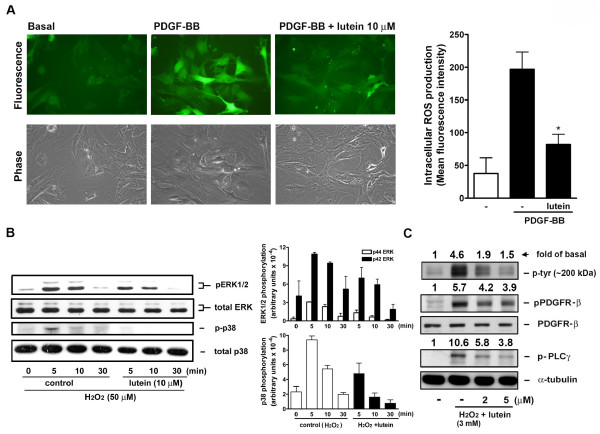
Figure 5.
Effect of lutein on PDGF-induced intracellular ROS production and H2O2 signaling. (A) VSMCs were treated with PDGF-BB (PDGF, 10 ng/ml) in the presence of vehicle (veh) or lutein (10 μM) for 10 min. Cells were immediately analyzed by fluorescence microscopy. The representative data from an experiment were shown (n = 5). The mean fluorescence intensity from the positive staining cells was calculated by the image analysis software. *P < 0.05 vs. control. (B and C) VSMCs were pretreated with vehicle (veh) or lutein for 30 min and followed by the addition of (B) H2O2 (50 μM) or (C) H2O2 (3 mM) for the indicated time. Cellular signaling was determined by Western blotting (n = 3). Quantitation of MAPKs and PDGFR and PLCγ phosphorylation was performed by densitometry. Data were expressed as (B) a bar graph or (C) indicated by a number.

