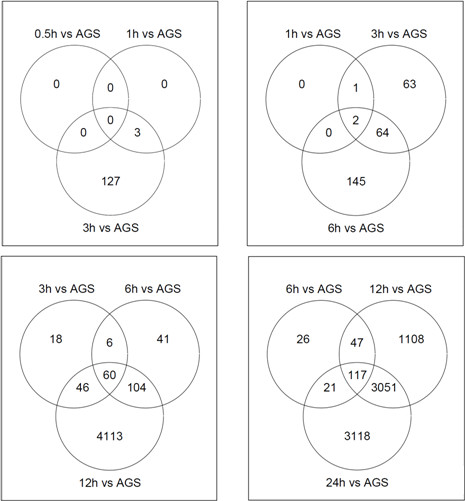
Figure 2.

Venn diagrams of significantly regulated genes. Venn diagrams of differentially expressed genes of H. pylori-infected AGS cells compared to control cells (p < 0.05). The intersecting circles indicate overlapping genes at the indicated time points. AGS = non-infected control AGS cells.
