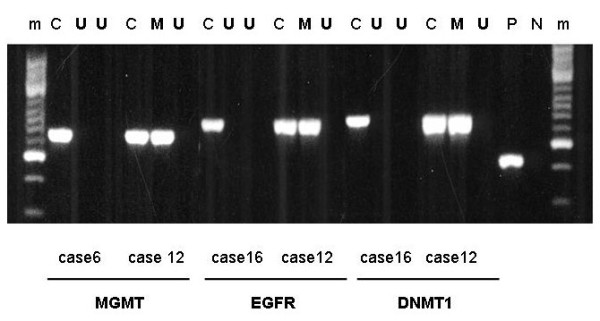
Figure 2.

Representative methylation analysis of CpG islands in the MGMT, EGFR and DNMT1 promoter in GL samples of cases 6, 12 and 16. C, undigested DNA samples; P, β2- microglobulin as a positive control; N, no DNA sample as a negative control; U, unmethylated DNA samples; M, methylated DNA samples, m, molecular weight marker
