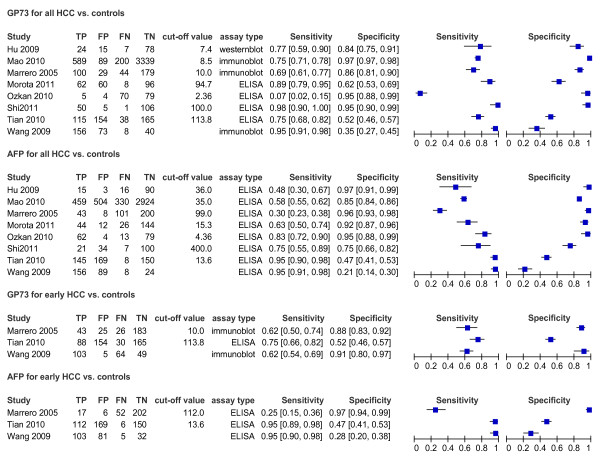
Figure 3.
Forest plot of pairs of sensitivity and specificity in each study included. TP = true positive; FP = false positive; FN = false negative; TN = true negative. Forest plots document the extracted data for each study together with estimates of sensitivity and specificity accompanied by 95% CIs.

