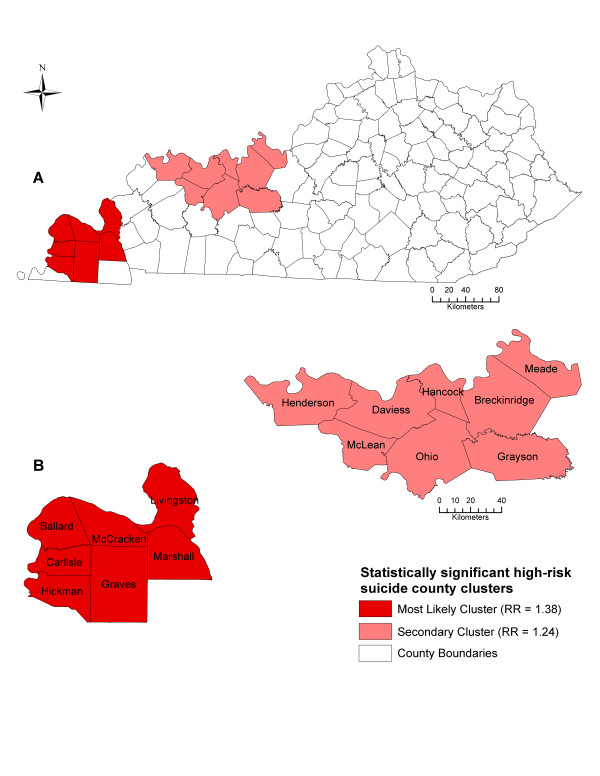
Figure 4.
Significant spatial clusters of high suicide mortality risks from 1999 to 2008 in Kentucky. These maps show the statistically significant (p < 0.05) high-risk spatial clusters of suicide in Kentucky (A) at the county level (B) from 1999-2008 detected by Kulldorff's spatial scan statistic, controlling for age and gender. RR = relative risk.

