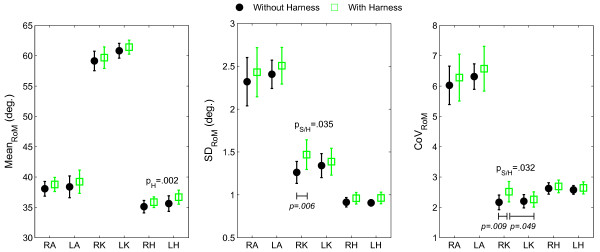
Figure 3.
Linear measures from the lower extremity joint range of motions. MeanRoM: central tendency, SDRoM: standard deviation, and CoVRoM: coefficient of variation, for the range of motion (RoM) of all three joints of the lower extremities. LA: left ankle. RA: right ankle. LK: left knee. RK: right knee. LH: left hip. RH: right hip. Error bars denote between-subjects standard error of the mean. Statistically significant effects in the two-way (Side: Right/Left; Harness: With/Without) repeated measures ANOVAs are reported, with pH and pS/H corresponding to p-values for the harness main effect and the side×harness interaction effect, respectively. Results from the post-hoc Tukey's HSD analyses are reported in the presence of an interaction effect, with the difference between average values indicated with horizontal bars and p-values.

