Figure 3.

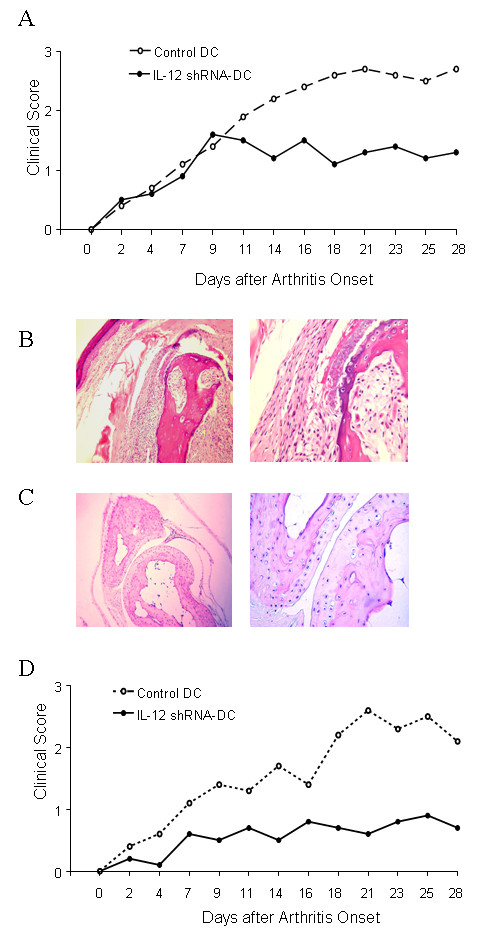
Inhibition of clinical development of CIA in mice injected with IL-12 shRNA-transfected DC. (A) Index of disease severity of joint after single DC treatment. 12 days after intradermal challenge with CII (200 μg per mouse), DBA/1 LacJ mice were treated with one i.p. injections of 5 × 10⁶ IL-12-silenced DC pulsed with CII (10 μg/ml). Control siRNA -transfected DC pulsed with CII served as a control. All mice were i.p. boosted with the same dose of CII 21 day after priming with the antigen. The animals were observed for 4 weeks since arthritis onset. Each limb was graded on a scale from 0 to 4 and the average clinical score per affected paw was calculated. Each point denotes the score of 5 mice in each group. Results represent 1 of 3 experiments. * = P < 0.05 versus control DC. (B) Histological sections of joints from arthritis mice injected with control DC. H&E stained sagittal sections of proximal interphalangeal joints. Sections from control mice show widespread inflammation cell infiltration, mild edema and congestion. Cartilage surface became uneven due to soft bone damage. (C) Histological sections of joints from arthritis mice injected with IL-12 shRNA-transfected DC. The majority of sections from animals treated with single injection of IL-12-silenced DC pulsed with CII do not show monocyte infiltration, edema and congestion. Cartilage surface appears smooth. Original magnification × 100. Results represent 1 of 15 mice. (D) Index of disease severity of joint after two DC treatments. 7 days before and 12 days after intradermal challenge with CII (200 μg per mouse), DBA/1 LacJ mice were treated with i.p. injections of 5 × 10⁶ IL-12-silenced DC pulsed with CII (10 μg/ml). Mock-transfected DC pulsed with CII served as a control. All mice were i.p. boosted with the same dose of CII 21 day after priming with the antigen. The animals were observed for 4 weeks since arthritis onset. Each limb was graded on a scale from 0 to 4 and the average clinical score per affected paw was calculated. Each point denotes the score of 5 mice in each group. Results represent 1 of 3 experiments. * = P < 0.05 versus control DC.
