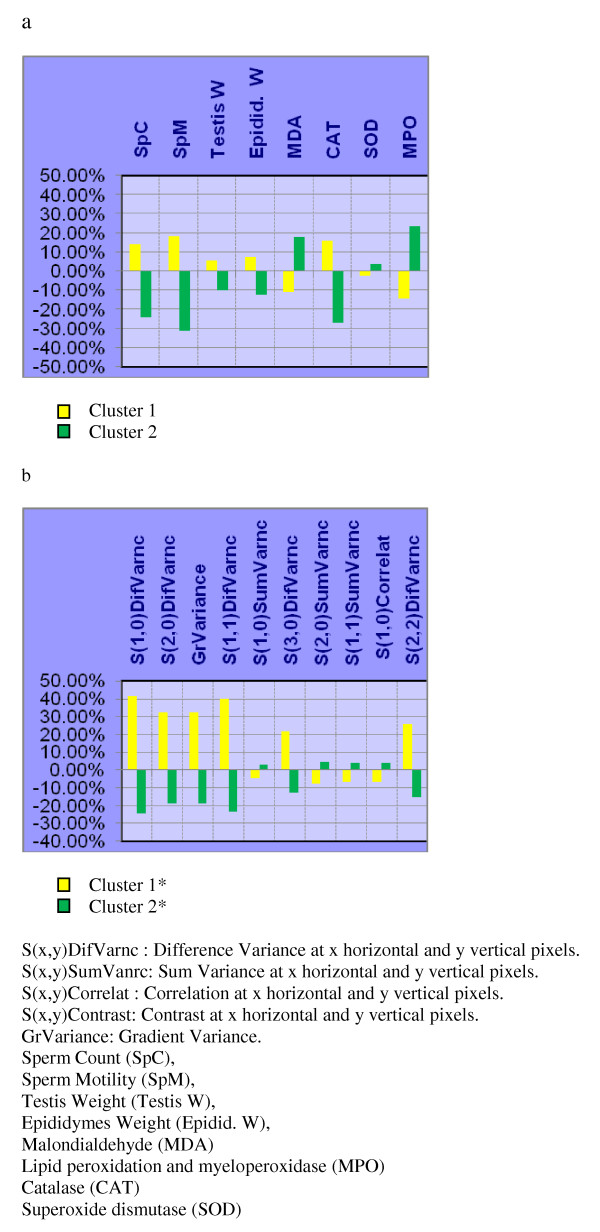
Figure 3.
Histogram representation of weighted averages of the individual descriptors of each cluster: a) Biochemical & fertility indicators; and, b) Texture Analysis parameters, on the groups: N, CIS, and CIS + H. Each point represents the weighted average of either a biochemical & fertility or texture parameter descriptor.

