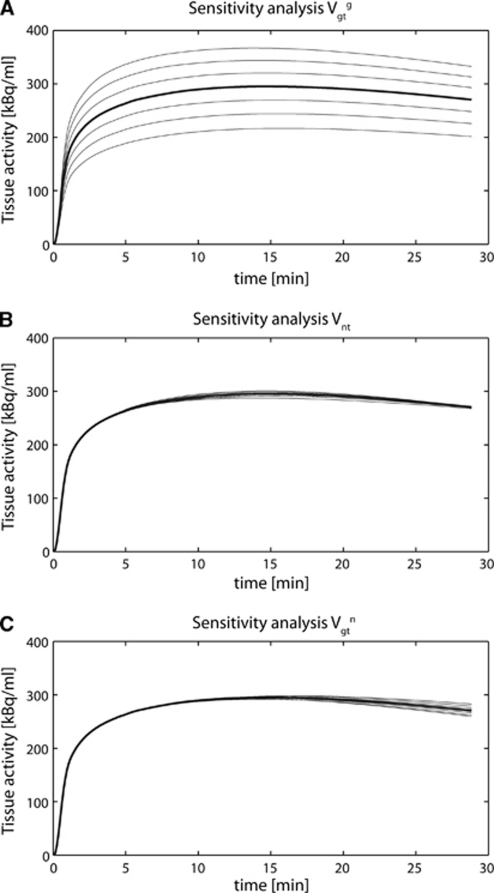
Figure 3.
Sensitivity analysis of the model relatively to the parameters Vgtg (A), Vnt (B), and Vgtn (C). The thick line represents the simulated data for (Vtcag=0.06, Vtcan=0.56, Vxg=Vxn=0.57, and Vnt=0.17 μmol/g per minute), using a typical arterial input function. The thinner lines represent each time a step of 10% increase or decrease in the corresponding parameter value. The sensitivity analysis shows that the curve is predominantly driven by the composite flux Vgtg, characterizing the label input in the glial glutamate C5 position.

