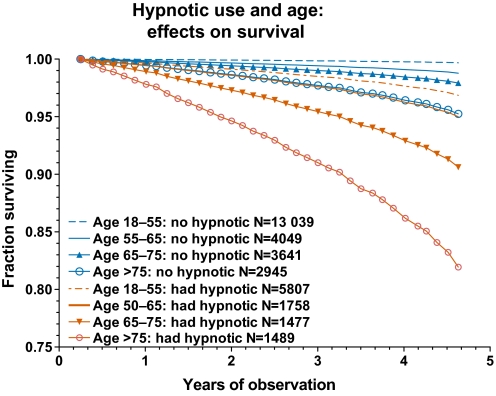
Figure 1.
Survival curves for patients prescribed no hypnotic are compared with survival curves for patients prescribed hypnotics, divided into four age groups (age at commencement of period of observation). These curves were derived from a special Cox proportional hazards model in which those taking and not taking hypnotics in the four age groups were coded as eight categories of an independent predictor variable. The curves represent the fraction of patients surviving over the increasing years of observation until censored (died, lost to follow-up or end of observation). Those censored <0.23 year of observation were excluded. The red curves represent the fact that a higher percentage of hypnotic users died during the observation periods and fewer survived. Each curve was adjusted for covariates except age (which shared excessive colinearity with the age-based categories) and was adjusted for comorbidity strata.

