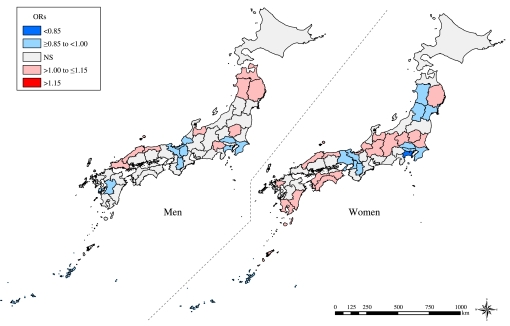
Figure 3.
Geographic inequality of all-cause premature mortality, Japan, 1970–2005. We show the overall geographic inequality of all-cause mortality across 47 prefectures, conditional on individual age, occupation and time-trends. Prefecture-level residuals are described in ORs with the reference being the grand mean of all the prefectures. Prefectures with a lower and a higher estimate of odds for mortality are filled with blue and red, respectively. Regarding areas filled with grey, prefecture-level residuals were not statistically significant.

