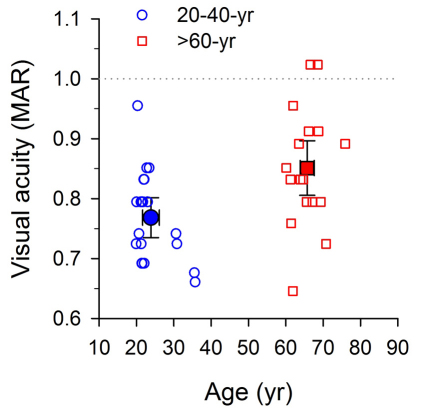
Figure 2. Visual acuity and Age.
Thirty-eight adults in total were recruited in two age groups: 21–40 years (blue circle symbols) and 60–80 years (red square symbols). All but two participants in each group had Snellen acuity of 20/20 (MAR = 1 arc min, the dotted line) or better in both eyes. The acuity difference between the two groups was small (approximately 2 letters on a standard LogMAR letter chart). Note that the visual acuity values reported represent the average of the monocular visual acuities for each observer. In this and the following figures, open symbols and solid symbols are used for showing individual and mean data respectively. Error bars represent ±two SEs, unless otherwise indicated.

