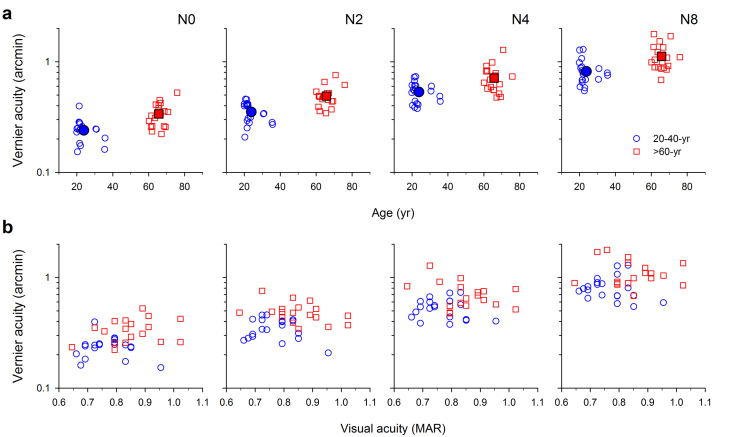
Figure 3. Vernier acuity and Age.
(a) Mean Vernier thresholds (solid symbols) were significantly elevated in the elderly group when compared with the younger group at all positional noise levels (N0, N2, N4 and N8), on average by 38% across all noise settings. Standard error bars are omitted in this figure for clarity. Open symbols show the acuity data for individual observers. (b) The individual Vernier acuities are replotted as a function of visual acuity. Within the acuity range between 0.6 and 1 arcmin, no statistically significant correlation was observed between visual acuity and Vernier acuity for any noise level.

