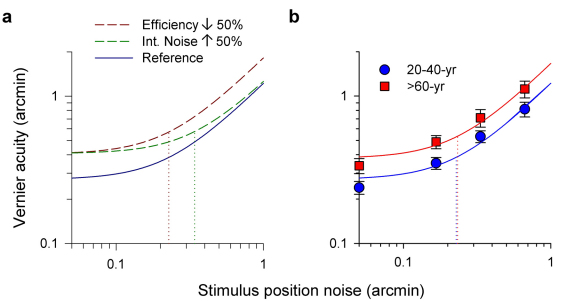
Figure 4. Ideal Positional Averaging Model.
(a) The dashed curves show the effects of (i) decreased sampling efficiency (by 50%; dark red) with fixed internal noise and (ii) increased internal noise (by 50%; dark green) with fixed efficiency in relation to a reference model (dark blue). The dotted lines indicate the magnitude of internal noise in each case. (b) Mean Vernier acuity data from Figure 3a were fitted with an ideal positional averaging model (Equation 1 in Methods; error bars: ±2SE). The TvN curve of the older group was displaced vertically upward relative to that of the younger group. The knee points (dotted lines) of the two curves are similar, indicating roughly the same internal noise levels for the two groups.

