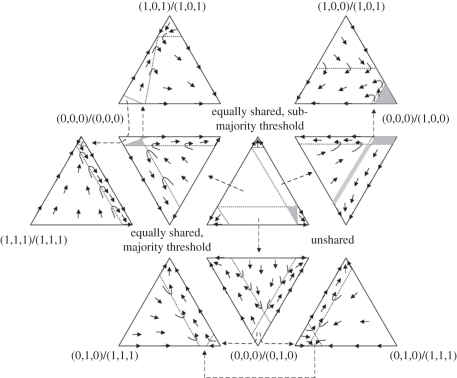
Figure 6.
Phenotypic evolution of decision-making about activity synchronization in groups of three (after Conradt & Roper [78]). Each trilinear coordinate system (TCS) represents populations consisting of three different phenotypes. Different TCSs are shown closely together to indicate the overall dynamics. Arrows show the directions in which the system evolves. Broken arrows indicate where the system evolves from one TCS to another. For clarity, in shaded areas, the direction of evolution is not shown, and the dynamics shown are not exhaustive (e.g. substituting ‘sub-majority’ for ‘super-majority’ phenotypes leads to similar dynamics).

