Figure 5.

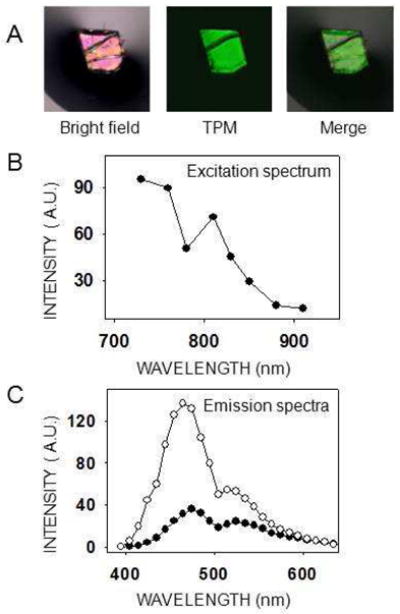
Excitation and emission spectra of a tetragonal lysozyme crystal. (A) The lysozyme crystal shown was imaged with either a bright field microscope (left) or a two–photon microscope with a 730 nm excitation wavelength (center). The two images are merged at the right. Scale bar is 150 μm. (B) Two–photon excitation spectrum of a tetragonal lysozyme crystal. Because no SHG was observed, the total emitted light was plotted for each excitation wavelength. Laser power settings were adjusted to deliver the same energy at every excitation wavelength. (C) Emission spectra of a lysozyme tetragonal crystal at two different excitation wavelengths, 760 nm (open circles) and 850 nm (closed circles).
