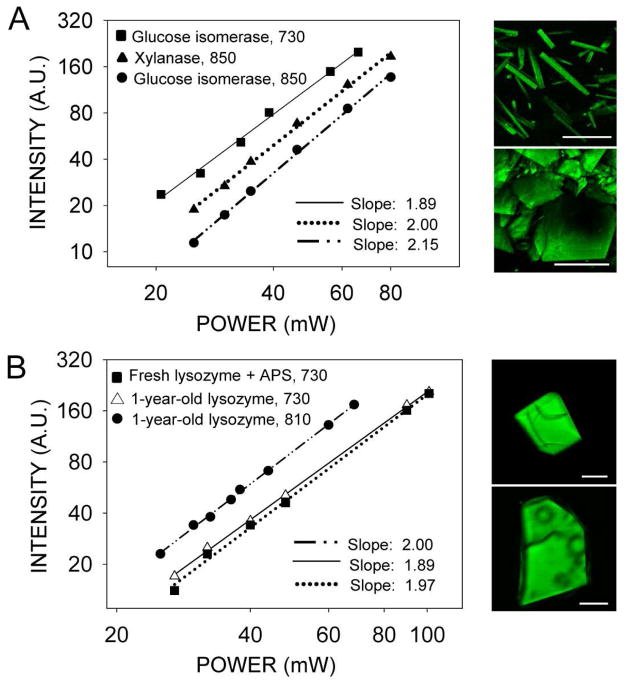
Figure 7.
Logarithmic plots of fluorescence intensity as a function of excitation power indicate a two-photon excitation process. (A) Vapor diffusion grown crystals of glucose isomerase and xylanase. Excitation wavelengths in nm are indicated next to the protein name in the upper left corner of the graph. Examples of TPM images are shown next to the graph. Upper panel: glucose isomerase excited with 730 nm; lower panel: xylanase excited with 850 nm. (B) One-year-old and fresh APS-aged tetragonal lysozyme crystals. Excitation wavelengths in nm are indicated next to the protein name in the upper left corner of the graph. Examples of TPM images are shown next to the graph. Upper panel: fresh lysozyme crystal incubated with 25 mM APS for 2 days before TPM imaging with 730 nm; lower panel: one-year-old lysozyme crystal imaged with 810 nm. The fitted slopes are represented in the lower right corners of each graph; in each case, r2 was higher than 0.995. Scale bars in the four images represent 150 μm.

