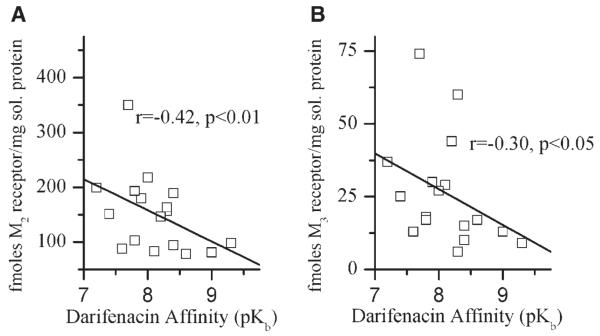
Fig. 3.
Correlation of urothelial M2 and M3 receptor density with darifenacin affinity determined using the underlying detrusor. Immunoprecipitation was performed as described in the Methods section. Each symbol represents receptor density in fmoles per mg solubilized protein for M2 (A) and M3 (B) determined in triplicate from each individual bladder urothelial specimen from an individual organ donor.

