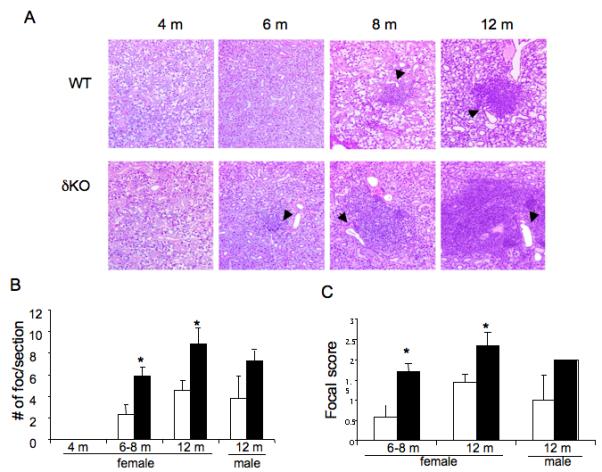
Figure 1. Lymphocytic infiltration in the submandibular glands of δKO mice with age.

Panel A: Pathology of submandibular glands from WT and δKO mice. Four uM section of the submandibular glands from WT (top panel) and δKO (bottom panel) female mice at 4 months, 8 months, and 12 months old were stained with H + E. Representative images at 200X are shown. Arrows indicate the location of interlobular ducts. Panel B: Quantification of lymphocytic infiltrates in the SMG gland. Graph shows a comparison of the foci number in the submandibular glands of female mice at 4 months, 6-8 months and 12 months of age, and male mice at 12 months of age; WT = white bars and δKO = black bars. The total number of foci in five 4 μM sections per animal (50 μM apart) was counted blindly and the data is presented as average number of foci/ section; *= p<.05 compared to WT using a 2-tailed t-test. Panel C: Graph shows scoring of lymphocytic foci in the submandibular glands of WT and δKO female mice at 6-8 month (WT, n=7; δKO, n=13) and 12 month of age (WT, n=7; δKO, n=6), and in 12 month old male mice (WT, n=4; δKO, n=6); WT (white bars) and δKO (black bars). Scoring was done blindly by a pathologist using the White-Cassaret method (15). The average score of the five sections was used to determine the total focal score for the animal; *=p<0.05 compared to WT using a 2-tailed t-test.
