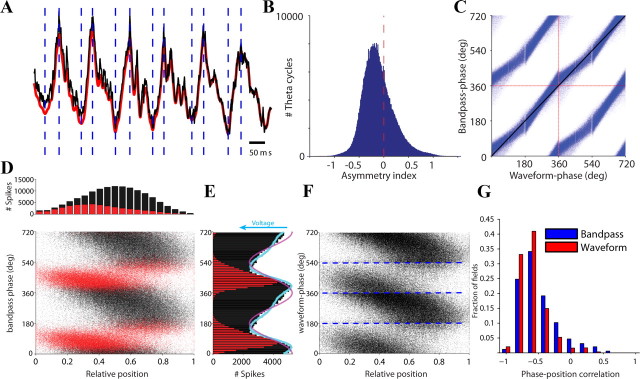
Figure 1.
Theta waves are asymmetric. A, Example trace of LFP from the CA1 pyramidal cell layer during a RUN. The black line shows the unfiltered LFP (1–1000 Hz; median of all CA1 recording sites); red trace is the bandpass-filtered (1–80 Hz) derivative. Vertical dashed lines mark local minima and maxima that were used subsequently to align individual theta cycles. B, Distribution of the asymmetry index: ratio of the duration of the ascending and descending parts expressed on a logarithmic scale. Zero corresponds to a symmetric theta waveshape. C, Comparison of bandpass-filtered (4–12 Hz) and waveform-based spike phases (blue dots). Two oscillation cycles (separated by dashed red lines) are shown for clarity. Identical phase estimates lie on the diagonal black line. Vertical stripes are due to discretization and sampling rate. D, Spike phase precession in a single rat. Bottom, For each spike, theta phase was determined from the filtered (4–12 Hz) LFP, and spike phases are plotted against the position of the animal within the field. Red and black dots denote spikes on the ascending and descending parts of the theta cycle, respectively. Top, Number of spikes at a given relative position of the rat in the place field. E, Spike density at different theta phases. For spikes with the same theta phase, the median of the simultaneously recorded voltage values in the raw LFP was determined. The resulting values were scaled to the peak and trough of the spike phase histogram (blue line). The polarity of the blue line is switched to match the histograms. A cosine wave (red line) is also shown to illustrate phase relationships. F, Spike phase precession for the same rat shown in D. The phases of the spikes were computed from the waveform-based theta phase. Blue lines represent detected peaks and troughs. G, Distribution of spike phase-position correlations (3 rats) calculated for waveform-based phases and bandpass (4–12 Hz) phases.

