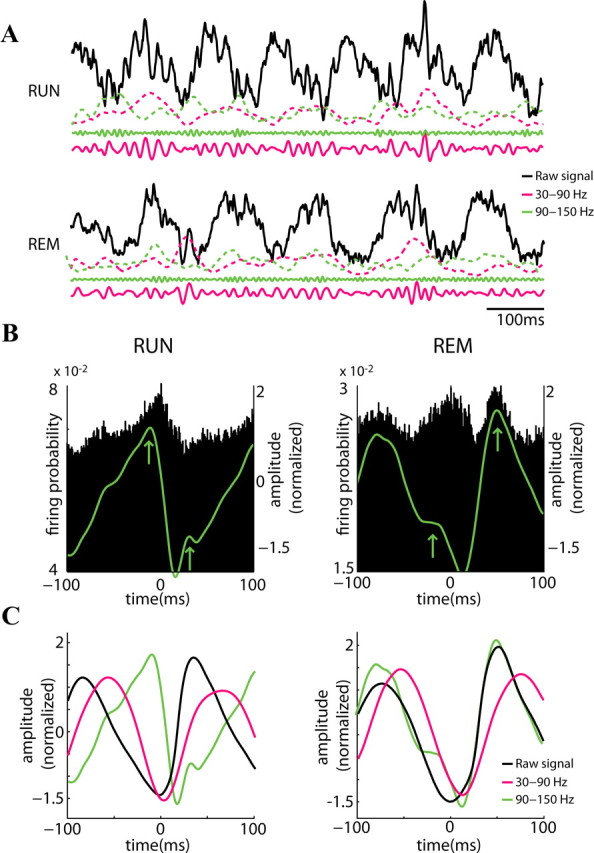
Figure 2.

State dependence of theta phase locking of gamma frequencies. A, Example raw trace (black; 1–1250 Hz) from the CA1 pyramidal cell layer during RUN (top) and REM (bottom). The solid magenta (30 to 90 Hz) and green (90 to 150 Hz) lines show filtered LFP and the respective dashed lines the (z-scored) power for each band. B, Probability of pyramidal cell firing (n = 372) related to the reference theta wave troughs (time 0). The superimposed green line shows the temporal distribution of mean LFP power in the 90 to 150 Hz band (z-score values). Note units have two maxima during the theta cycle, largely corresponding to the two peaks of the 90–150 Hz power (arrows). C, Temporal relationship between theta trough-triggered raw LFP (black) and integrated power in the 30 to 90 Hz band (magenta). The amplitude values of the signals are z-scored. Note similar theta phase relationship with 30 to 90 Hz power and different preferred theta phases of 90 to 150 Hz power during RUN and REM.
