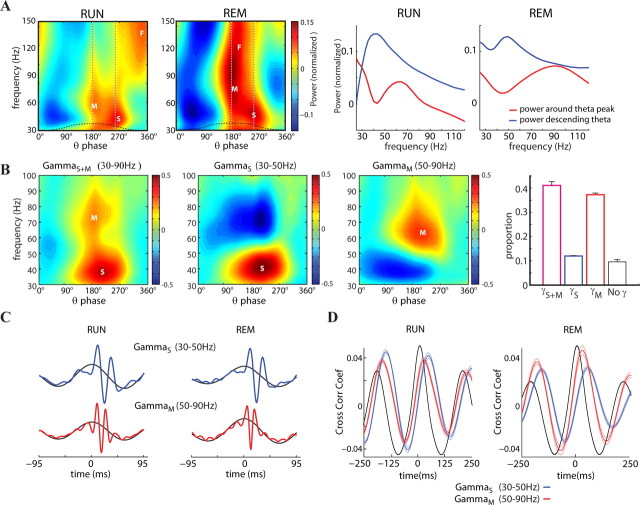
Figure 3.
Discrete low (S), middle (M), and fast (F) bands of gamma oscillations. A, Left panels show the mean wavelet power between 30 and 150 Hz as a function of the waveform-based theta cycle phases (bin, 9°) for RUN and REM (0°, trough of theta cycle). Right panels show the mean power around the peak (red line, mean between 125 and 216°) and during the descending part (blue line, mean between 216 and 288°) of the theta wave. The dashed vertical lines in the left panels represent the centers of the windows used for the calculation of the mean power. Note different theta phase preference of gammaM (50–90 Hz, near theta peak) and gammaS (30–50 Hz, on the descending phase of theta). Note also phase shifting of gammaF (90–150 Hz; ε band) from the trough of theta during RUN to the peak of theta during REM (as in Fig. 2). Power values were normalized by frequency band by its mean and SD for each session. Blue and red colors emphasize relative power distributions. B, Example average wavelet maps of theta cycles during RUN with both gammaS and gammaM, gammaS only, and gammaM only. Right, Population distribution of theta cycles (mean ± SE) with both gammaS and gammaM, gammaS only, gammaM, and cycles with no detected gamma. The threshold for the inclusion was >2 SD of gamma power (relative to the session mean) in a given theta cycle. S, M, and F mark gammaS, gammaM and gammaF (ε) bands, respectively. C, Gamma trough-triggered LFP. Troughs of filtered (30–50 Hz, blue; 50–90 Hz, magenta) traces >2 SD of the session mean were detected and used to trigger LFP (1–1250 Hz, colored lines) or theta-filtered LFP (4–12 Hz; black lines) during RUN and REM sessions. Traces are aligned to the peak of the theta LFP. D, Cross-correlation between theta LFP (4–12 Hz) and power of filtered (gammaS, 30–50 Hz; gammaM, 50–90 Hz) gamma waves (mean ± SE). Black line, Autocorrelation of the theta band.

