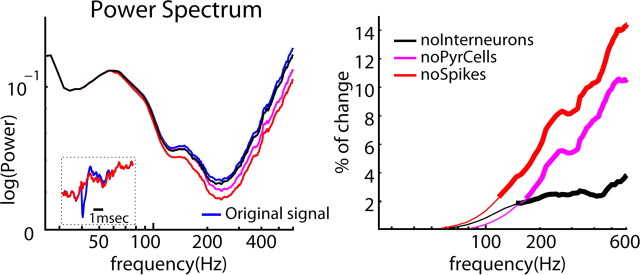
Figure 5.
Spike contribution to gammaF. Left, Mean power of the original “whitened” signal from the CA1 pyramidal layer (blue) and its despiked derivatives. Magenta, Pyramidal cells spikes removed; black, interneurons removed; red, spikes of both cell classes removed. Inset, Single spike of an example pyramidal cell (blue) and its surrogate (red) after removal the mean spike from the LFP. Right, Percentage of change of power (1 − despike power/original power) at different frequencies after despiking the LFP. Thick lines indicate significantly different values between the original and despiked LFPs (p < 0.01, t test). noInterneurons, After removal of spikes of putative interneurons; noPyrCells, after removal of spikes of pyramidal cells; noSpikes, after removal of all spikes.

