
Figure 7.
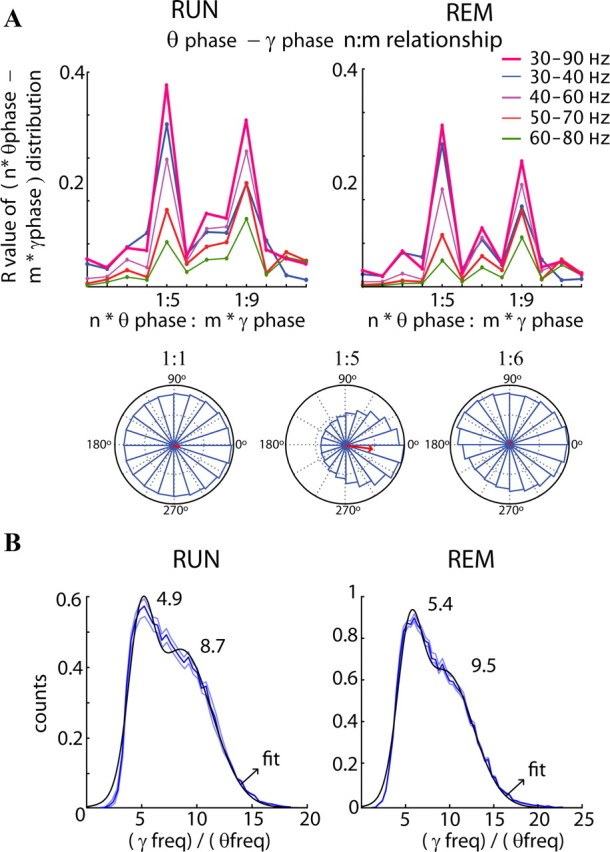
Phase–phase (n:m) coupling between theta and gamma oscillations. A, Top, Mean radial distance values (R values) from the distribution of the difference between theta and gamma phases calculated for different n:m relationships during RUN and REM. The procedure was repeated for several filtered bands in the gamma frequency band. Note large peaks at 5 (mainly for band 30–40 Hz) and 9 (mainly for 50–80 Hz). The bottom panels show examples of the distribution of the difference between theta and gamma phases for three different n:m relationships (1:1, 1:5, and 1:6). Only the distribution using the 1:5 ratio shows a unimodal distribution around 0 with a high R value. B, Distribution of the ratios between gamma (30–90 Hz) and theta frequency (4–12 Hz; blue lines, mean ± SE). For every theta cycle, the maximum in the power spectrum in the range between 30 and 90 Hz was compared with the corresponding theta cycle frequency (1/duration). The black line is the fitted Gaussian to the distribution with the center of mass for each function displayed (with a confidence of 95%). Note the peaks at ∼5 (gammaS) and ∼9 (gammaM).