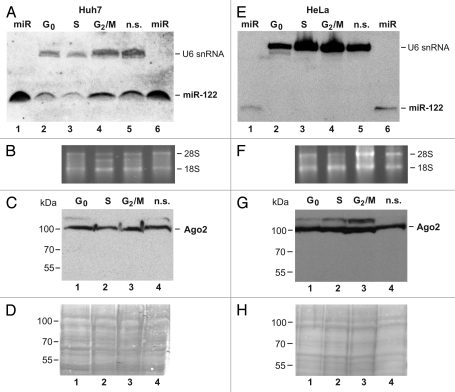
Figure 5.
Detection of miRNP complex components during the cell cycle. Left parts (A–D): Huh7 cells; right parts (E–H): HeLa cells. (A) Northern blot detecting microRNA-122. Lanes 2–5 show the small RNAs from cells synchronized to the cell cycle phases as indicated. Total RNA amounts were normalized to cell numbers before loading. RNAs extracted from each 1.4 × 10⁸ cells was loaded per lane. In lanes 1 and 6, each 2 ng of miR-122 were applied as positive control. U6 snRNA was detected as a control. (B) Total RNA ethidium bromide stain of the samples shown in (A) as gel loading control. (C) Western blot with an anti-Ago 2 antibody. Lanes 1–3 show the proteins from cells synchonized to the cell cycle phases as indicated, lane 4 from non-synchronized cells. Total protein amounts were normalized to cell numbers before loading, with cell extracts from each 2 × 10⁴ cells loaded per lane. (D) Poinceau S stain of the gel shown in (C) as loading control. (E–H) Assays like in (A–D) but with HeLa cells.

