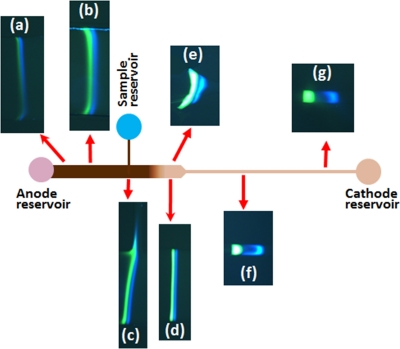
Figure 8.
Time series photos of stacked proteins during cationic ITP in a 2D gradual reduction cascade PMMA microchip. The width and depth of the channel varies with location as shown in the Fig. 1b. (a) The proteins start to stack into ITP zones. (b) The ITP zones become brighter after accumulating more proteins. (c) The proteins have accumulated most of its total mass loaded onto the microchip. Some sample is lost due to migration through T-junction. (d) The proteins have passed the depth change region and protein bands become more easily visualized. (e) The proteins are passing through the width change and two distinct bands become brighter and wider. (f) The proteins are in the smallest cross-sectional area portion of the channel and the bands become more distinct with a gap between the two proteins. (g) The proteins are at the end of channel and have stacked into nearly pure zones.

