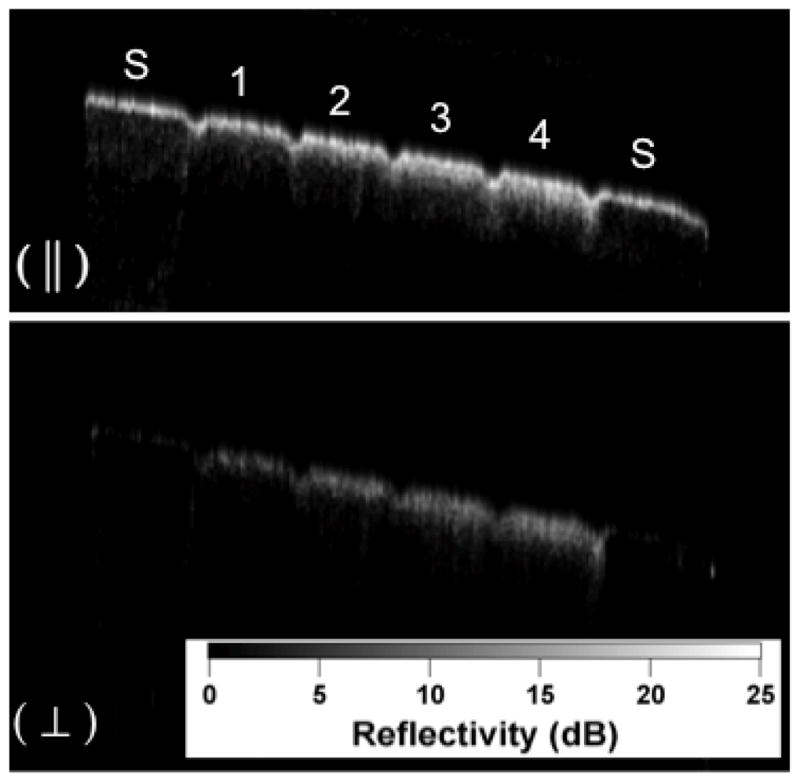
Fig. 1.

PS-OCT b-scan images of one of the samples with 8-hour period of demineralization created using the surface softened lesion model. The sound areas on each end of the samples are marked (S) and the four areas of increasing demineralization separated by the laser incisions are labeled 1–4. Only the orthogonal polarization (⊥) or cross polarization image was used for analysis in these studies.
