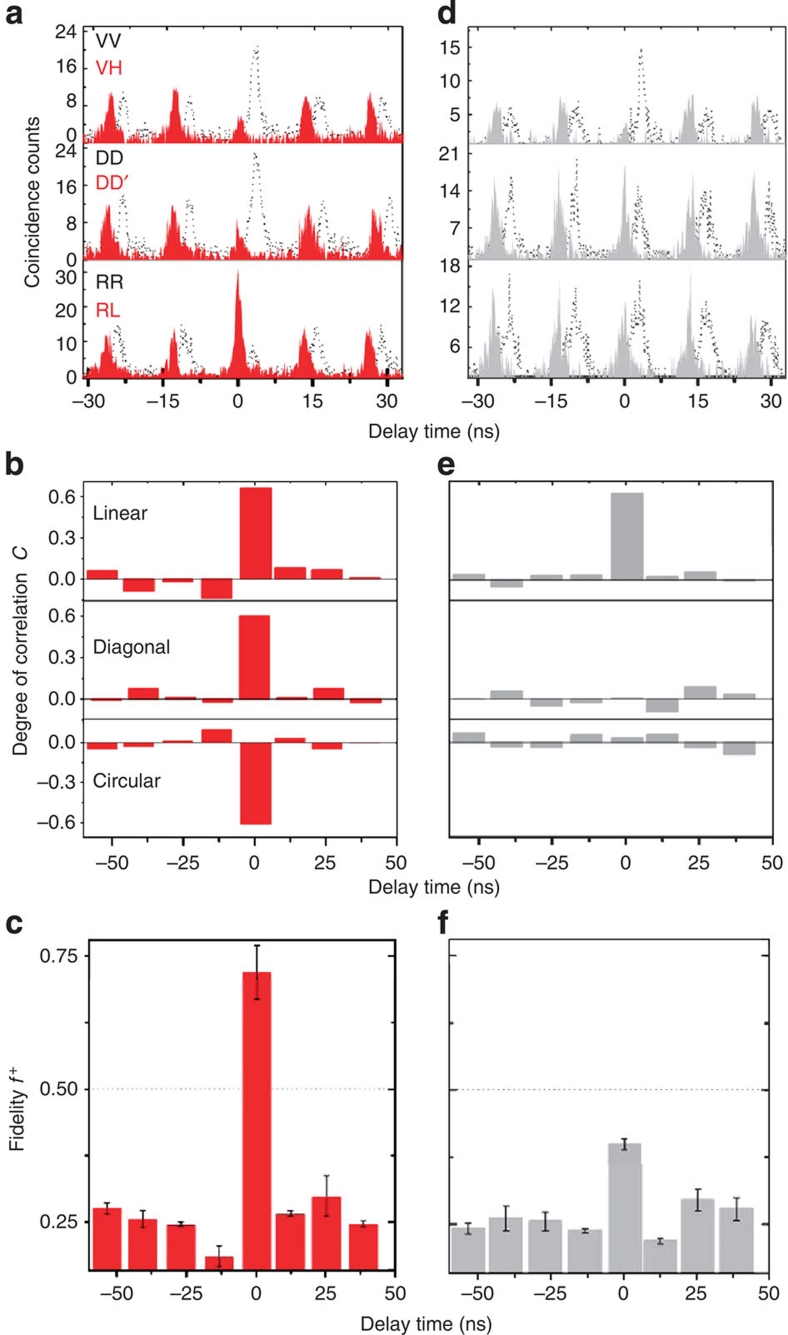
Figure 4. Second-order cross-photon correlation histograms of biexciton–exciton photons.
(a) Exciton and biexciton coincident counts for E=29.2 kV cm−1 (ΔFSS~0) as a function of the delay time. The black dotted lines represent the coincident counts measured for photons of the same polarization, and the solid red lines show the orthogonal polarizations. (b) Degree of correlation C at E=29.2 kV cm−1 for the linear (top), the diagonal (middle) and the circular (bottom) bases. (c) Fidelity f+ for several central pulse periods at E=29.2 kV cm−1. (d) Exciton and biexciton coincident counts for E=18 kV cm−1 (ΔFSS=30 μeV) as a function of the delay time. The black dotted lines represent the coincident counts measured for photons of the same polarization, and the solid grey lines show the orthogonal polarizations. (e) Degree of correlation C at E=18 kV cm−1 for the linear (top), the diagonal (middle) and the circular (bottom) bases. (f) Fidelity f+ for several central pulse periods at E=18 kV cm−1. The QD was excited quasi-resonantly by the 740 nm laser energy to minimize the recapture of the carriers into the dot. The black dotted histograms in a and d are time-shifted for clarity. The top, the middle and the bottom panels in a and d show the coincident counts measured in the linear, the diagonal and the circular basis angles, respectively: H, horizontal; V, vertical; D, diagonal; D′ orthodiagonal; R, right; L, left. The averaged accumulation times for the histograms measured at E=18 and 29.2 kV cm−1 were 160 and 200 min, respectively.

