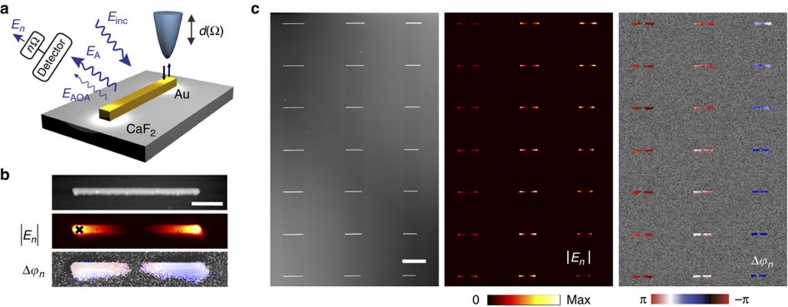
Figure 3. Spatial mapping of surface-enhanced light scattering.
(a) A Si tip (vertically oscillating at frequency Ω) is scanned across a Au rod antenna (A). Both antenna and tip (the latter mimicking the scattering object O) are illuminated with s-polarized light. The s-polarized light backscattered from the tip-antenna configuration is detected interferometrically (not shown). Demodulation of the detector signal at a higher harmonic nΩ yields the amplitude |En| and the phase Δϕn at each position of the tip. (b) Topography, amplitude |En| and phase shift Δϕn maps of a Au rod antenna. The scale bar denotes 1 μm. (c) From left to right, topography, amplitude |En| and phase shift Δϕn maps of Au rods. The length of the rods decreases from the top to the bottom and from the left to the right). The illumination wavelength was 11.1 μm. Demodulation was done with n=4. The scale bar denotes 5 μm.

