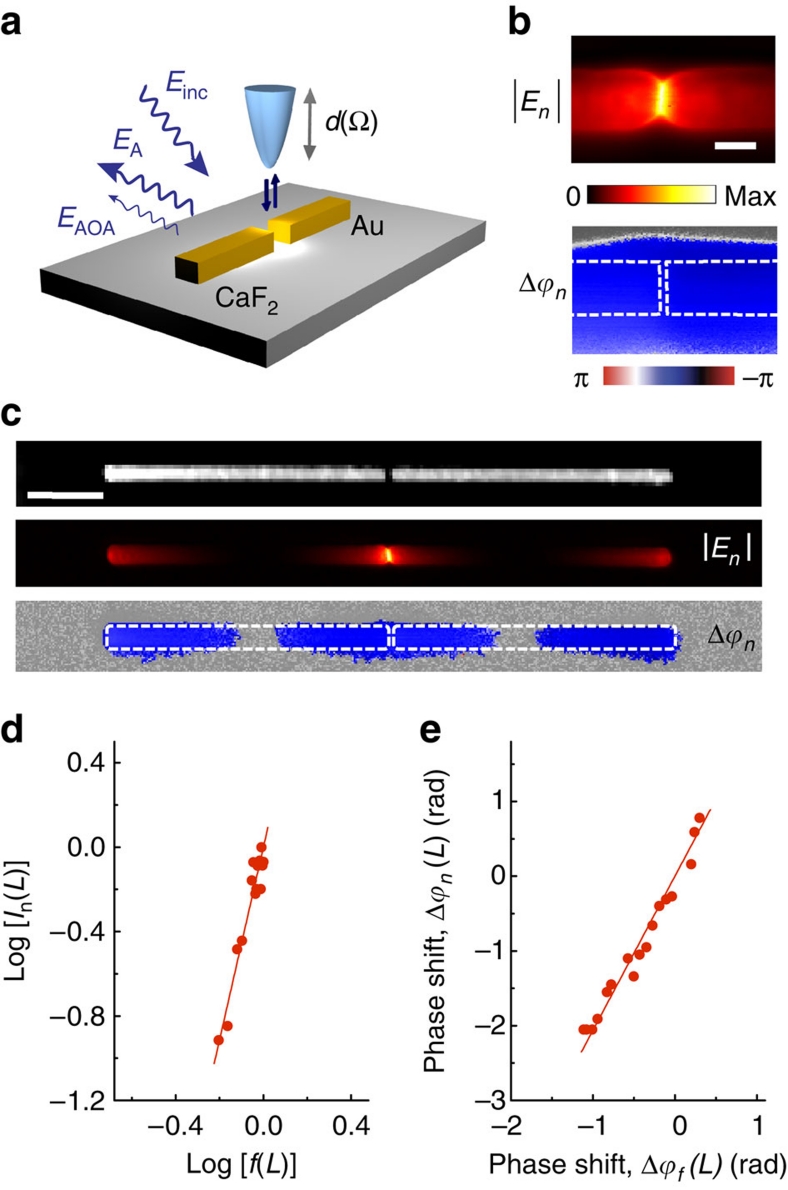
Figure 5. Elastic light scattering in the hot spot of infrared gap antennas.
(a) A Si tip (vertically oscillating at frequency Ω) is scanned across a Au rod antenna (A). Both antenna and tip (the latter mimicking the scattering object O) are illuminated with s-polarized light. The s-polarized light backscattered from the tip-antenna configuration is detected interferometrically (not shown). Demodulation of the detector signal at nΩ yields the amplitude |En| and phase shift Δϕn at each position of the tip. (b) Zoom-in amplitude |En| and phase shift Δϕn images of the gap region in a resonant gap antenna. A full width at half maximum of the hot spot of about 50 nm is measured. The scale bar denotes 100 nm. (c) Topography, amplitude |En| and phase shift Δϕn maps of a resonant gap antenna. The maps were recorded at an excitation wavelength of 11.1 μm and demodulation was done with n=4. The scale bar denotes 2 μm. (d) Parametric representation of log[In(L)] and log[f(L)] (red symbols). A linear least-square fitting of the data points (red solid line) yields a slope of 4.56. (e) Parametric representation of Δϕn(L) and Δϕf(L) (red symbols). Linear least-square fitting of the data yields the relation Δϕn=1.99Δϕf.

