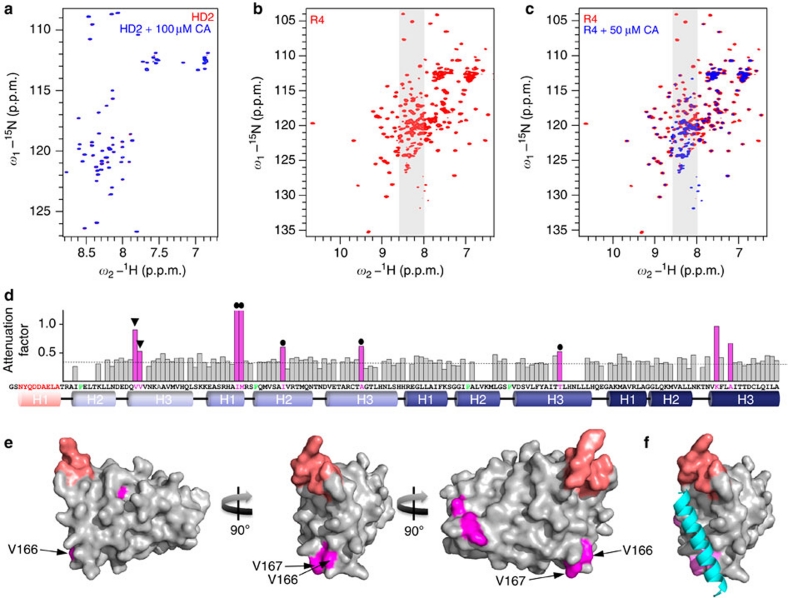
Figure 3. R4 contains the molecular target of CA.
(a) Overlay of HSQC of 15N-labelled HD2+CA (100 μM each) onto 15N-labelled HD2 (100 μM) with solvent only, as indicated. (b) HSQC of 15N-labelled R4 (50 μM); (c) overlay of 15N-labelled R4+CA (50 μM each) onto 15N-labelled R4 (50 μM) with solvent only, as indicated; the 8.0–8.6 p.p.m. range of proton chemical shifts is shaded in grey. (d) Map of CA-induced attenuation factors derived from c onto individual R4 residues (α-helices, cylinders underneath sequence; red, H1 residues; green, prolines); attenuation factors were calculated from peak signal intensities of R4/R4+CA (purple, attenuation of signal intensity >2 standard deviations above average of CA-induced reduction of overall signal intensity, indicated by dashed line); 123/138 peaks from the assigned R4ΔH1 spectrum (Supplementary Fig. S6) were scored (black dots, N-terminal R4 core residues; arrows, HD2-binding surface residues). (e,f) Projections of CA-induced intensity changes, colour-coded as in c, onto the R4 apo structure (f, with HD2 added; see also Supplementary Fig. S3); valines at the HD2-binding site are labelled.

