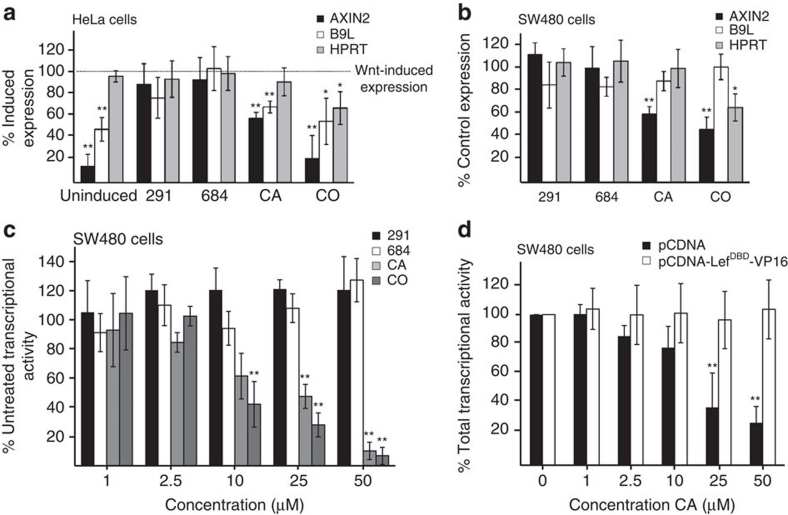
Figure 5. CA inhibits β-catenin activity in human cells.
(a,b) Real-time quantitative PCR analysis in (a) LiCl-stimulated HeLa or (b) SW480 cells, exposed to 25 μM compound for 6 h as indicated (explanations as in Fig. 2). Percent reductions of transcript levels relative to (a) DMSO-treated LiCl-induced control or (b) DMSO-treated control values are shown at the *P<0.01 and **P<0.001 significance levels. (c,d) TOPFLASH assays in SW480 cells, transfected with (c) empty vector or (d) LEF-VP16 transactivator, on treatment with increasing concentrations of compound as indicated; reductions of relative luciferase values as percentage of DMSO-treated control values are shown; significance as in a and b. Error bars, standard deviations (n=4).

