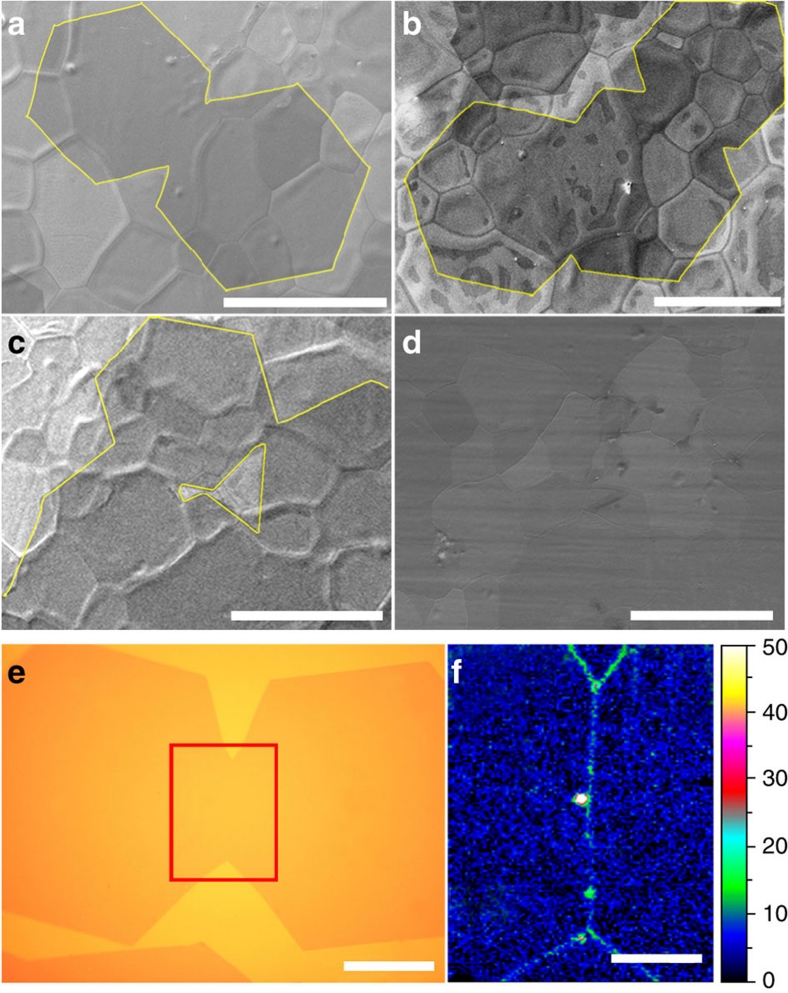
Figure 2. Coalescence of graphene grains.
Scanning electron microscope (SEM) image of the coalescence of different graphene grains: (a) two; (b) three; (c) many; (d) continuous graphene film formed from grains. The graphene film completely covers the Pt substrates without any gaps. (e) Optical image of two coalesced graphene grains. (f) Raman mapping of the intensity of D band (1,300–1,400 cm−1) at the joint area of the two coalesced grains indicated by a red box in (e). The strong intensities along the line in the mapping indicate a grain boundary. The scale bars in (a–d) are 400 μm, in (e) 50 μm, and in (f) 20 μm.

