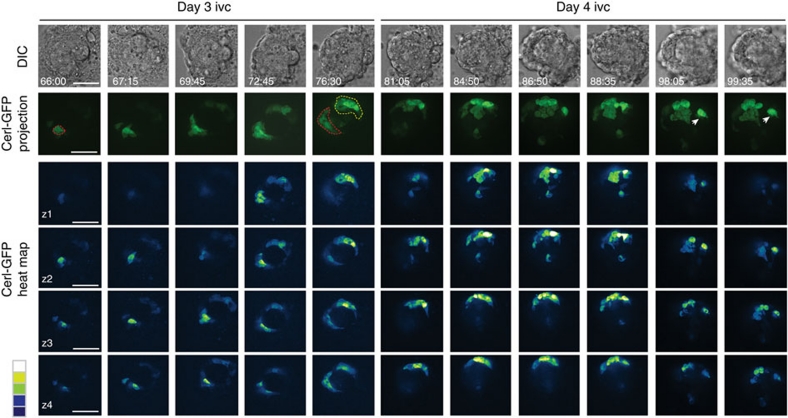
Figure 5. Time-lapse-imaging of blastocysts cultured in vitro reveals the formation of the AVE.
Day 3: within 6 h of the onset of expression of Cerl-GFP in a single cell (red-dotted lines, top panel), two opposing domains of Cerl-GFP-expressing cells can be observed in the primitive endoderm (red- and yellow-dotted lines; Supplementary Movie 6). Day 4: Cerl-GFP-expressing cells become progressively restricted to one side of the nascent egg cylinder. Among these, the brightest cell (white arrow) becomes progressively distant from the central domain. Scale bars represent 100 μm. The lower panels represent heatmaps of the intensity levels of Cerl-GFP on four different topical sections. The colour bar on the left-hand side of the bottom panel is the look-up table for GFP intensity in which white is the brightest. The GFP fluorescence is a maximum intensity projection over the z-axis of confocal sections. ivc, in vitro culture.

