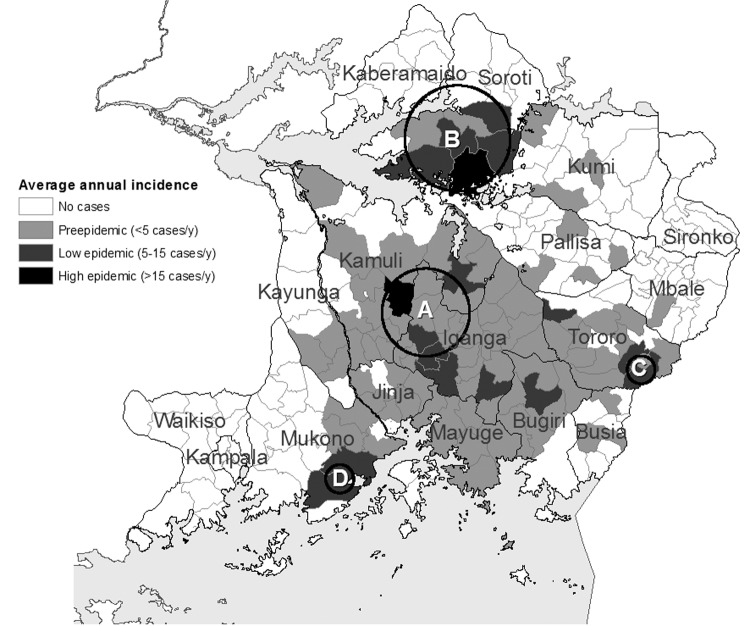
Figure 8.
Sleeping sickness incidence in southeastern Uganda, 1998–2003, by subcounty. Circles indicate significant primary (A) and secondary (B, C, and D) space-time clusters at the 95% confidence level, as detected by the space-time scan test. Letters correspond to cluster results in Table. See Table for scan test results.

