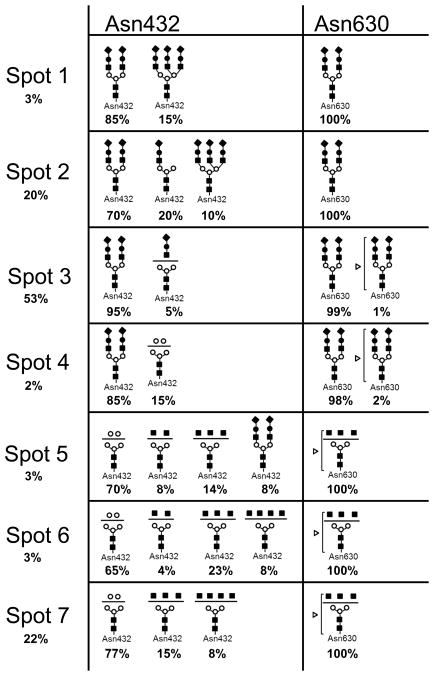
Table 2. Potential transferrin glycovariants detected in each transferrin 2-DE spot.
The relative amount of Tf glycovariants in each spot was deduced from the relative intensity of its corresponding spot to the total and is indicated as (%) in column 1. When a glycopeptide mixture was detected in a given spot, relative abundance for each species was deduced from the relative peak intensities in the deconvoluted mass spectra and these are indicated in (%) under each glycopeptide structure. For example, Spot 3 contained 95% of Tf glycovariant harboring a bi-antennary sialilated glycan at both Asn432 and Asn630 and minor Tf glycovariant (1 to 5%) harboring a truncated glycan at Asn432 and a trace amount of a fucosylated glycan at Asn630 [5, 19].

|
